A Geek’s Portal to Their Network: Zabbix Monitoring!
As a Homelabber myself, I want to know what is going on with my network at all times. It is a little overkill, but I have set up a free application that lets me do just that: Zabbix. Zabbix Monitoring is a network monitoring software that enables you to keep a close eye on all network activity. The application is extremely scalable and may be used on networks of any size, from a small home network with a few PCs to a large business network with hundreds. It is cross-platform and can monitor computers running Linux, Windows, or Mac OS X. You may use it to monitor all aspects of these different devices. You may request reports from Zabbix on a variety of topics, including free disk space, CPU load, network traffic statistics, memory usage, and application status.
Zabbix stores all gathered data in databases such as MySQL, although it may also be integrated with PostgreSQL and SQLite databases. Zabbix is an awesome at generating warnings and graphs. It is capable of sending warnings through Jabber/XMPP instant messaging or email. In addition to monitoring, Zabbix enables you to configure actions on remote computers that are performed automatically in response to preset events. Additionally, Zabbix excels at visualizing your network. It generates real-time graphs of observed events and supports graphs, network maps, screens, and even slideshows, making it ideal for complicated networks with system administrators that prefer graphical data displays.
Components of Zabbix Monitoring
A monitoring application serves two primary purposes: it gathers data from all network devices and reports it to a central controlling authority. Zabbix performs these duties via the use of two critical components: zabbix-server and zabbix-agent.
As the name implies, you install zabbix-agent on any devices on your network that you intend to monitor. The agent can monitor both hardware and software resources and pushes all gathered data to zabbix-server. The zabbix-agent is available for Linux, FreeBSD, OpenBSD, NetBSD, HP-UX, Mac OS X, Solaris, and several versions of Windows. The other component, zabbix-server, is in charge of polling and data collection. In the event of a problem or outage, the server notifies the specified accounts. On your network, you just need to install one instance of zabbix-server.
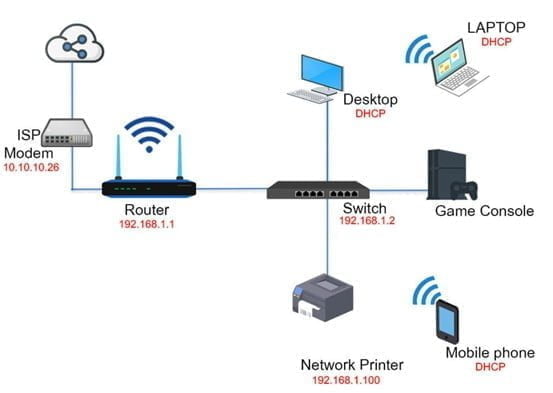
Apart from zabbix-agent, Zabbix supports device monitoring through the SNMP protocol. While zabbix-agent is capable of monitoring both physical and virtual computers, SNMP is capable of monitoring network devices such as routers and switches, as well as servers, assuming they have been configured to do so.
Zabbix provides a centralized web interface via which you may manage the events being monitored throughout the network. Due to the sheer volume of functions available, the interface may appear too complicated and difficult to many first-time users. However, the program is well-documented and easy to use, and you’ll learn to love the UI with time.
How to get Zabbix working?
Zabbix may be installed in two ways. You may compile and install Zabbix from source code or, if your distribution allows it, you can install Zabbix packages. While installing packages is faster and simplifies maintenance, installing from source takes longer but optimizes the application for your server. I’ll use precompiled binaries from the official Zabbix repository in this tutorial.
- To add and install the Zabbix repository on Ubuntu, use the following commands:
- sudo dpkg -i zabbix-release_4.2-1+bionic_all.deb
- sudo apt update
- sudo apt upgrade
- After installing the repository, use it to install Zabbix server with the MariaDB database and the Zabbix front end:
- sudo apt install zabbix-server-mysql
- sudo apt install zabbix-frontend-php
- Before continuing, we’ll create a password for the MariaDB server’s root user using a script that also runs through other standard security setup options:
sudo mysql_secure_installation
- Now, using the newly established database server credentials, build a database for Zabbix:
sudo mysql -uroot -p
- Create the Zabbix database from within the MariaDB monitor:
create database zabbix;
- Create a new database user named zabbix to provide access to the newly created zabbix database:
- grant all privileges on zabbix.* to zabbix@localhost identified by ‘Password’;
- exit;
- The Zabbix installation includes the schema for the first database, which you may import using a single command into the newly formed zabbix database:
sudo zcat /usr/share/doc/zabbix-server-mysql/create.sql.gz |mysql -uzabbix -p zabbix
- Once the operation has completed and the database has been populated, the Zabbix server must be pointed to the database:
sudo nano /etc/zabbix/zabbix_server.conf
- Scroll down the file and update the following settings to ensure that the server has the right authentication information for the zabbix database:
- DBHost=localhost
- DBName=zabbix
- DBUser=zabbix
- DBPassword=<password>
- Using the Zabbix binaries has the advantage of immediately installing the Apache web server and creating a virtual host file for Zabbix. However, you will need to modify the virtual host file to change some settings:
sudo nano /etc/apache2/conf-enabled/zabbix.conf
- For the reason that we are using PHP 7, scroll down to the <IfModule mod php7.c> section and update the following settings to the values listed below:
- php_value max_execution_time 600
- php_value memory_limit 128M
- php_value post_max_size 64M
- php_value upload_max_filesize 16M
- php_value max_input_time 600
- php_value max_input_vars 10000
- Now you need to restart the following services:
- sudo systemctl restart apache2.service
- sudo systemctl start zabbix-server.service
- sudo systemctl enable zabbix-server.service
Create a web interface configuration
Now, open a web browser and navigate to the IP address/zabbix server that you specified. If your server is located at 172.16.24.8, for example, you would navigate to http://172.16.24.8/zabbix. You will see an installer page where you may perform the final few installation steps necessary to configure the web interface. To begin, click “Next step” on the welcome screen.
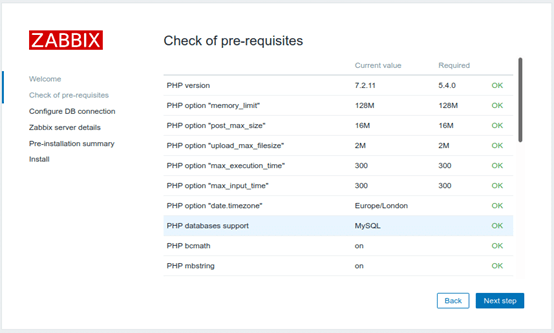
Zabbix will next do a requirement check. If you followed this tutorial to the letter, you should have no problems here; however, if you do, you will most likely need to install more PHP packages or modify settings in /etc/php-fpm.d/zabbix.conf to match the needed value. If everything is in order, click “Next step”.
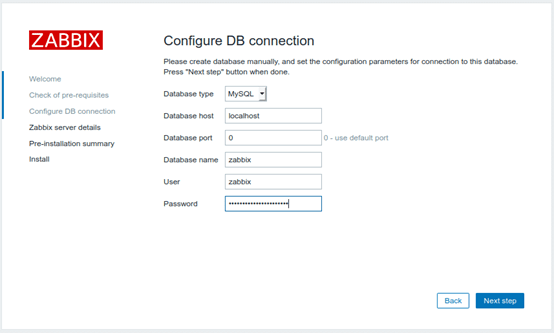
Following that, we must instruct the web interface on how to connect to the database. Enter the following values in the same order as they appear in /etc/zabbix/zabbix server.conf:
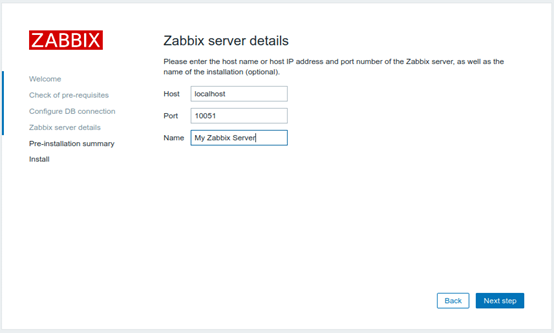
You will then be requested to direct the Zabbix frontend to the Zabbix server’s location. Because the server and frontend are installed on the same host, we accept the default value of localhost. Additionally, you may give the installation a name of your choice to help identify it:
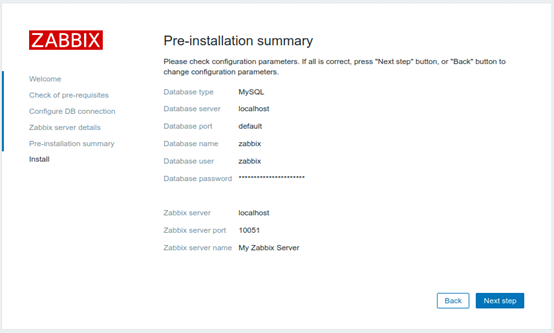
On the final page before the installation begins, you’re presented with a summary of the options you’ve selected; take a quick glance over them to ensure they’re all correct, and then proceed to the next step to begin the installation.
When the installation process is complete, click “Finish” to go to the login screen. Log in with the default credentials (Administrator | zabbix). Please keep in mind that the username is case sensitive.
After logging in, you’ll see the default dashboard, which indicates that Zabbix has begun monitoring itself. In my situation, there is also a notice indicating that there is insufficient free swap space. Although this is predictable given that I did not create a swap partition on this server, it is helpful to ensure that monitoring and alerting are functioning properly.
The first thing you should do is update your password by clicking the user icon in the upper right corner of the screen next to the logout button. Additionally, you may rename the admin account for added protection.
Conclusion
Of course, having a monitoring server that monitors only itself is pointless, and you will ultimately want to add more sites to watch. For the time being, however, experiment with the menus to determine the type of data that may be collected and the types of warnings that are generated before adding further hosts. A critical component of monitoring is determining the information in which you are interested and fine-tuning your monitoring system to meet those demands. While it may appear tempting to collect a large amount of data and begin monitoring hundreds of hosts at once, it is very easy to miss critical information when the system is overburdened with alerts. Therefore, start slowly while testing and learning the system and gradually add hosts as you refine your alerts.

Matthew J Fitzgerald is an experienced DevOps engineer, Company Founder, Author, and Programmer. He Founded Fitzgerald Tech Solutions and several other startups. He enjoys playing in his homelab, gardening, playing the drums, rooting for Chicago and Purdue sports, and hanging out with friends.