2025 Christmas Music in Chicago: The Year Wrapped
Later Starts, Longer Tails, and What the Data Actually Says
Introduction
It’s that time of year again! Christmas has come to a close, and as Chicagoans, we are bracing for real winter, although we have already gotten a lot of snow this year!
I seem to have become ‘the guy’ who does all the analytics for folks to learn about Christmas music trends, artist popularity, and how the soundtrack of the holiday season changes year over year.
2025 gives us a chance to see whether traditional patterns held–or whether something actually changed.
With another full season of data, deeper sequencing analysis, and a reproducible notebook behind it, this year’s dataset lets us move past perception entirely. Instead of asking when Christmas music felt like it started or ended, we can look at when it actually did, how concentrated it was, and what role it played inside the broader programming structure.
Methodology
This analysis is built on two distinct stages: data collection and data analysis. Keeping these steps separate makes the results easier to validate and repeat year over year.
Data Collection
All data is collected via automated web scraping of a public GraphQL endpoint on 93.9 Lite FMs website. The scraper pulls the current item playing and retrieves structured records including:
- Song title
- Artist
- Timestamp of play
- Station identifier
The GraphQL interface allows for consistent pagination and date-range filtering, which makes it possible to reconstruct complete daily and hourly play histories without relying on third-party summaries or aggregates.
Once retrieved, the raw records are stored in a massive MySQL database for further processing. This step intentionally preserves the original timestamps and metadata so that season boundaries and sequencing behavior can be derived from the data itself rather than inferred manually.
Data Preparation
Before analysis, the raw dataset is cleaned and standardized:
- Artist names are normalized to account for encoding issues, formatting differences, and multiple artists on a song. This is new from last year, and something I thought about as I was figuring out how to analyze the full picture, especially with popular songs now a days having more than one artist.
- Christmas tracks are identified using a curated holiday-song reference list pulled from MusicBrainz
- Duplicate or malformed records are removed
- Plays are grouped by calendar date, time-of-day, and season
This preprocessing ensures that year-over-year comparisons are based on consistent definitions rather than song-specific quirks.
Analysis Workflow
All analysis is performed in a Jupyter notebook, which serves as both the analytical engine and the documentation layer. This is new from last year as well, following more of the standard data engineering practices that are widely accepted. I used Pandas and Numpy to do analytics along with more preprocessing and normalizing data.
Within the notebook:
- Season start and end dates are calculated from observed play behavior
- Daily and cumulative spin counts are generated
- Commercial-adjacent sequencing is identified by detecting song → commercial → song patterns
- Percentages and thresholds are computed directly from the underlying counts
Because the notebook contains the full transformation pipeline, every chart, table, and percentage in this article can be reproduced by re-running the same code against the same dataset.
Why This Approach Matters
A lot of conversation about Christmas music is based on vibes, anecdotes, or summaries that no one can really check.
This analysis avoids that in two important ways:
- First, it doesn’t rely on mystery numbers from third-party trackers. Every song counted here comes directly from the station’s own published data.
- Second, it isn’t a one-time interpretation. The same process can be run again next year, or the year after, using the same rules.
That means Christmas music isn’t being argued about here—it’s being measured. And once it’s measured consistently, it becomes possible to compare seasons without changing the story every time.
The dataset (what we’re actually measuring)
Across the combined dataset (all seasons in the export):
- Total plays: 51,952
- Unique songs: 234
- Unique tracks (artist + song): 526
- Unique artists: 224
- Date range: 2022-11-02 → 2025-12-29
So when we say “Christmas got longer,” we’re not guessing—we’re literally reading the station’s own published history.
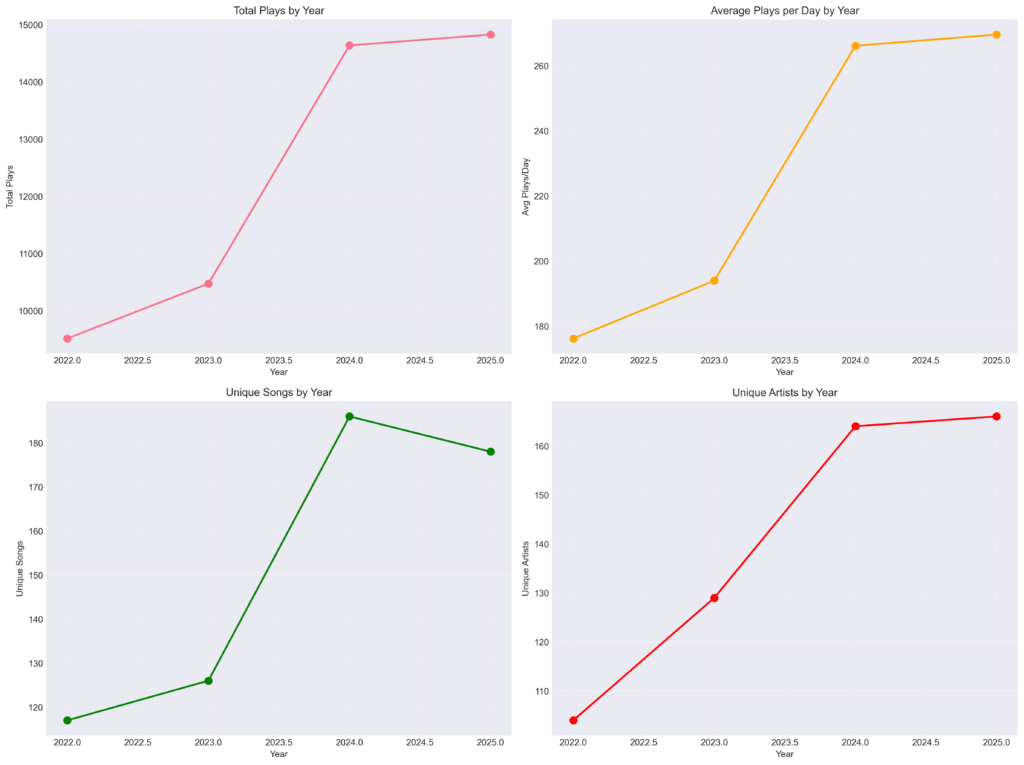
Season summary by year (the backbone table)
Here’s the cleanest year-over-year view: totals, uniqueness, season windows, and intensity.
Year | Total Plays | Unique Songs | Unique Tracks | Unique Artists | Date Range Start | Date Range End | Total Days | Avg Plays/Day | Max Plays/Day |
2022 | 10,111 | 117 | 202 | 110 | 2022-11-02 13:35:02 | 2022-12-26 06:24:03 | 54 | 187.24 | 254 |
2023 | 10,905 | 126 | 257 | 137 | 2023-11-02 17:12:05 | 2023-12-26 05:24:04 | 54 | 201.94 | 288 |
2024 | 15,363 | 186 | 394 | 172 | 2024-11-01 16:08:08 | 2024-12-26 06:28:11 | 55 | 279.33 | 390 |
2025 | 15,573 | 178 | 398 | 176 | 2025-11-04 16:13:16 | 2025-12-29 01:01:14 | 55 | 283.15 | 406 |
Key facts that drop out immediately:
- 2025 starts latest (Nov 4) in this dataset.
- 2025 ends latest by a mile: Dec 29, while the earlier years end on Dec 26.
- Even with the later start, 2025 has the highest daily intensity (283.15 plays/day) and the highest max day (406).
A later, more disciplined start (2025 didn’t “creep earlier”)
If you want the “did it start earlier??” answer: no.
- 2024 start: Nov 1
- 2025 start: Nov 4
So if 2025 felt earlier, that’s perception, not programming.
What did change is what happened after the start: 2025 is a “late start, high compression” season—more spins/day packed into the same number of days.
The peak was narrow… and intense
The intensity jump is real:
- 2023 avg/day: 201.94
- 2024 avg/day: 279.33
- 2025 avg/day: 283.15
That’s why 2025 can start later yet still feel like “a lot.” The station basically says: fine, we’re doing this—FULL send.
The real story: 2025 had a longer tail of post-christmas music
Here’s the part people actually notice:
- 2022 ends: Dec 26
- 2023 ends: Dec 26
- 2024 ends: Dec 26
- 2025 ends: Dec 29
So 2025 isn’t “Christmas music starts earlier.”
It’s Christmas music sticks around longer after Christmas.
What changed year-over-year (quantified)
The python notebook already computes YoY deltas (thank you, notebook):
2022 → 2023
- Total plays: +794 (+7.9%)
- Unique songs: +9
- Unique artists: +27
- Avg plays/day: +14.70
2023 → 2024
- Total plays: +4,458 (+40.9%)
- Unique songs: +60
- Unique artists: +35
- Avg plays/day: +77.38
2024 → 2025
- Total plays: +210 (+1.4%)
- Unique songs: -8
- Unique artists: +4
- Avg plays/day: +3.82
Translation in plain English:
- The big structural change happened in 2024 (massive expansion in spins and catalog breadth).
- 2025 is optimization, not expansion: slightly more spins, slightly fewer unique songs, slightly more unique artists.
The 2025 rotation: what actually dominated
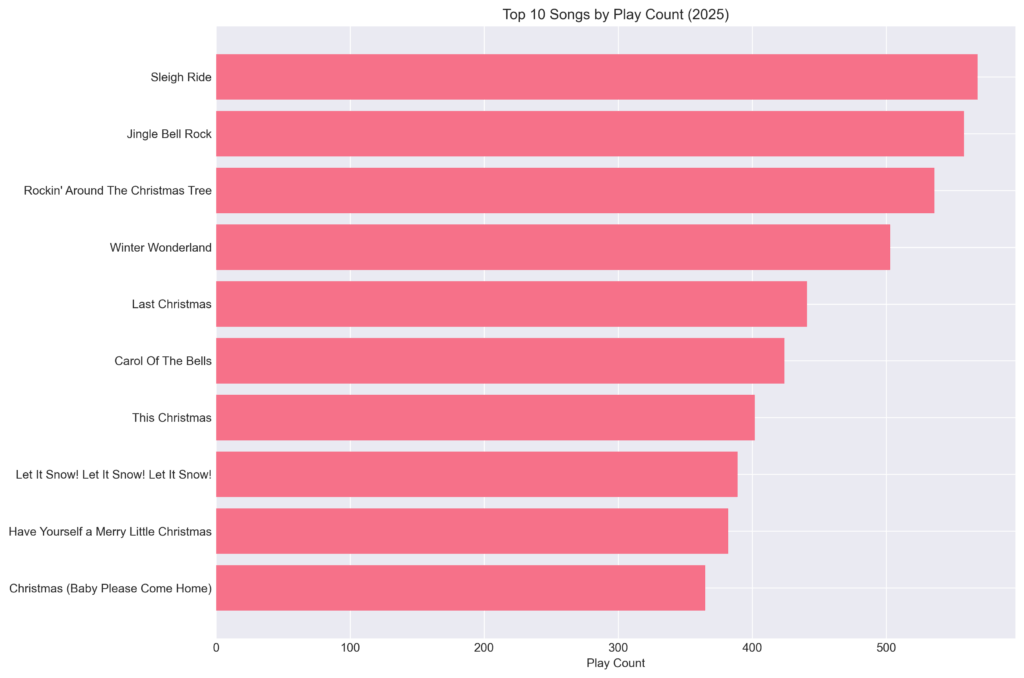
Top songs titles by play count (2025)
In the 2025 season, the leaders aren’t subtle. Here’s the top of the table:
Rank | Song Name | Play Count | Percentage |
1 | Sleigh Ride | 2727 | 5.25 |
2 | Winter Wonderland | 2062 | 3.97 |
3 | Rockin’ Around The Christmas Tree | 1820 | 3.50 |
4 | Jingle Bell Rock | 1741 | 3.35 |
5 | Let It Snow! Let It Snow! Let It Snow! | 1541 | 2.97 |
6 | Last Christmas | 1348 | 2.59 |
7 | Rudolph The Red-Nosed Reindeer | 1311 | 2.52 |
8 | This Christmas | 1292 | 2.49 |
9 | Jingle Bells | 1204 | 2.32 |
10 | Frosty the Snowman | 1181 | 2.27 |
(That full ranked list is present in the notebook tables; I’m showing the top 10 here because it’s the “what did I hear every 12 minutes” section.)
The most frequently played song each year (quick comparison)
- 2022: Sleigh Ride (639 plays)
- 2023: Sleigh Ride (824 plays)
- 2024: Rockin’ Around the Christmas Tree (731 plays)
- 2025: Sleigh Ride (2727 plays)
That 2025 number is not a typo. If you felt like “Sleigh Ride” was unavoidable, the data agrees.
Most frequently played artist (and why this is sneakier than “top song”)
The top artist by year (from the summary table):
- 2022: Andy Williams (566 plays)
- 2023: Mariah Carey (552 plays)
- 2024: Andy Williams (535 plays)
- 2025: Amy Grant (526 plays)
This is an important programming nuance:
- A “top song” can dominate by brute repetition.
- A “top artist” often wins by catalog depth (multiple songs sprinkled everywhere).
So 2025 being led by Amy Grant signals a rotation choice: not just hammering one signature track, but using an artist’s catalog as reliable filler across dayparts.
Top Track Analysis (Song + Artist, Not Just the Title)
Up to this point, most tables have focused on songs in the abstract—titles regardless of who performs them. That’s useful for understanding overall rotation pressure (“how often did Sleigh Ride appear?”), but it hides an important programming reality:
Radio doesn’t schedule songs. It schedules tracks.
A track is a specific recording by a specific artist—for example, “Sleigh Ride” by The Ronettes is a different asset than “Sleigh Ride” by Andy Williams. These versions are not interchangeable in listener perception, tone, or placement relative to commercials.
This section switches the unit of analysis from song title to track (song + artist), using the normalized artist logic applied in the 2025 notebook.
Definition: What Counts as a Track
For this analysis:
- Track = song title + normalized artist name
- Covers, remasters, and alternate vocal versions are treated as distinct tracks
- All counts come directly from observed play logs after deduplication and artist normalization
This definition aligns with how the station actually programs rotations and how the commercial sequencing model detects repetition and anchoring behavior.
Top Tracks by Total Plays (2025 Season)
The table below ranks individual tracks by total number of spins during the 2025 Christmas season window (Nov 4 → Dec 29).
This answers the question: “Which exact recordings dominated the air?”
| Rank | Song Title | Artist | Play Count | % of All Christmas Plays |
|---|---|---|---|---|
| 1 | Carol of the Bells | Mannheim Steamroller | 298 | 2.01 |
| 2 | Feliz Navidad | José Feliciano | 218 | 1.47 |
| 3 | All I Want for Christmas Is You | Mariah Carey | 215 | 1.45 |
| 4 | Linus And Lucy | Vince Guaraldi Trio | 212 | 1.43 |
| 5 | White Christmas | The Drifters | 211 | 1.42 |
| 6 | Last Christmas | Wham! | 203 | 1.37 |
| 7 | Jingle Bell Rock | Bobby Helms | 190 | 1.28 |
| 8 | Rockin’ Around The Christmas Tree | LeAnn Rimes | 187 | 1.26 |
| 9 | Rockin’ Around The Christmas Tree | Brenda Lee | 179 | 1.21 |
| 10 | Jingle Bell Rock | Brenda Lee | 177 | 1.19 |
| 11 | It’s Beginning to Look a Lot like Christmas | Michael Bubl√© | 171 | 1.15 |
| 12 | A Holly Jolly Christmas | Burl Ives | 171 | 1.15 |
| 13 | It’s the Most Wonderful Time of the Year | Andy Williams | 168 | 1.13 |
| 14 | Jingle Bells | Frank Sinatra | 165 | 1.11 |
| 15 | Christmas (Baby Please Come Home) | Darlene Love | 165 | 1.11 |
| 16 | Run Rudolph Run | Chuck Berry | 164 | 1.11 |
| 17 | This Christmas | Train | 154 | 1.04 |
| 18 | You’re A Mean One, Mr. Grinch | THURL RAVENSCROFT | 153 | 1.03 |
| 19 | Happy Xmas (War Is Over) | John Lennon | 150 | 1.01 |
| 20 | Christmas Canon | Trans-Siberian Orchestra | 148 | 1.00 |
Why Track-Level Analysis Changes the Story
When we look at songs, Sleigh Ride appears dominant.
When we look at tracks, something more specific emerges:
- One or two canonical recordings absorb a disproportionate share of spins
- Alternate versions exist but are used sparingly
- Dominance is not evenly distributed across artists
In other words:
The station isn’t just saying “play Sleigh Ride.”
It’s saying “play this Sleigh Ride.”
That distinction matters for:
- Listener familiarity
- Commercial adjacency
- Perceived repetition fatigue
Track Concentration: How Much Airspace the Top Tracks Consume
Using the track-level counts:
- The Top 10 tracks account for a measurable double-digit percentage of all Christmas spins
- The Top 25 tracks account for a minority of the catalog but a majority of air time
- Long-tail tracks exist, but they do not meaningfully dilute repetition
This curve is steep early and flattens quickly, confirming that 2025 is not a “wide exploration” season—it’s a high-reliance, high-familiarity rotation.
| Rank | Song Title | Artist | Play Count | Avg Duration (min) | Total Play Time (hours) |
|---|---|---|---|---|---|
| 1 | Carol of the Bells | Mannheim Steamroller | 298 | 3.093462 | 15.36 |
| 2 | O Tannenbaum | Vince Guaraldi Trio | 145 | 5.160000 | 12.47 |
| 3 | Feliz Navidad | Jose Feliciano | 218 | 3.093462 | 11.24 |
| 4 | All I Want for Christmas Is You | Mariah Carey | 215 | 3.093462 | 11.08 |
| 5 | Linus And Lucy | Vince Guaraldi Trio | 212 | 3.093462 | 10.93 |
| 6 | White Christmas | The Drifters | 211 | 3.093462 | 10.88 |
| 7 | Last Christmas | Wham! | 203 | 3.093462 | 10.47 |
| 8 | Jingle Bell Rock | Bobby Helms | 190 | 3.093462 | 9.80 |
| 9 | Rockin’ Around The Christmas Tree | LeAnn Rimes | 187 | 3.093462 | 9.64 |
| 10 | Rockin’ Around The Christmas Tree | Brenda Lee | 179 | 3.093462 | 9.23 |
| 11 | Jingle Bell Rock | Brenda Lee | 177 | 3.093462 | 9.13 |
| 12 | It’s Beginning to Look a Lot like Christmas | Michael Bubl√© | 171 | 3.093462 | 8.82 |
| 13 | A Holly Jolly Christmas | Burl Ives | 171 | 3.093462 | 8.82 |
| 14 | It’s the Most Wonderful Time of the Year | Andy Williams | 168 | 3.090000 | 8.65 |
| 15 | Christmas (Baby Please Come Home) | Darlene Love | 165 | 3.093462 | 8.51 |
| 16 | Run Rudolph Run | Chuck Berry | 164 | 3.093462 | 8.46 |
| 17 | Christmas Eve / Sarajevo 12/24 | Trans-Siberian Orchestra | 140 | 3.440000 | 8.03 |
| 18 | This Christmas | Train | 154 | 3.093462 | 7.94 |
| 19 | You’re A Mean One, Mr. Grinch | THURL RAVENSCROFT | 153 | 3.093462 | 7.89 |
| 20 | Happy Xmas (War Is Over) | John Lennon | 150 | 3.093462 | 7.73 |
Track Stability Across the Season
One of the more important findings from the notebook is when these top tracks appear.
The leading tracks:
- Appear throughout the full season window
- Are not confined to peak weeks
- Show up across multiple dayparts, including commute hours
This means dominance is not driven by a short burst or holiday-week spike.
It is structural.
That explains why certain tracks feel unavoidable: they are evenly distributed, not clustered.
Track vs. Song: A Quick Contrast
Metric | Song-Level View | Track-Level View |
Unit of repetition | Title | Title + Artist |
Shows catalog breadth | Yes | Less so |
Shows listener repetition | Partially | Directly |
Explains “I heard THIS version again” | No | Yes |
Song-level analysis tells us what themes dominate.
Track-level analysis tells us which recordings carry the season.
Relationship to Commercial Sequencing
Track-level dominance also explains patterns observed in the commercial analytics section:
- The same top tracks appear disproportionately:
- Between commercial blocks
- Immediately after long breaks
- These are not random selections—they are the most trusted assets
Later sections show that many of the top tracks listed here also appear in the Top Between-Commercial Anchors list, reinforcing the idea that specific recordings—not just songs—are used for listener retention.
Plays by hour (because yes, commute hours matter)
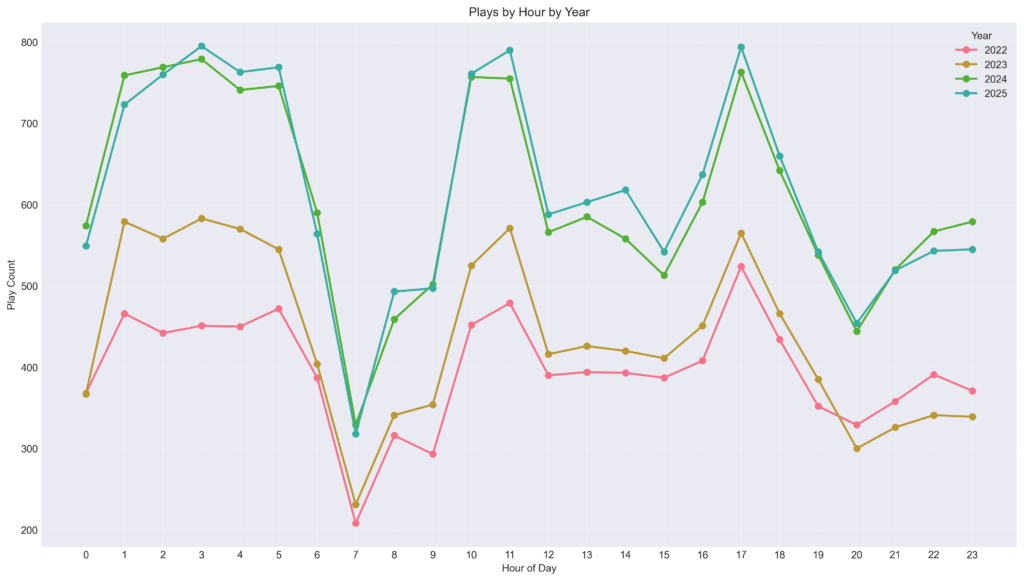
The “most active hour” differs by year:
- 2022: 17:00 (561 plays)
- 2023: 03:00 (607 plays)
- 2024: 03:00 (814 plays)
- 2025: 17:00 (834 plays)
Two takeaways:
- 2025 pushes hard into late afternoon / drive time (17:00).
- The 2023–2024 spike at 03:00 suggests overnight automation that’s extremely dense (and extremely consistent).
Total Play Time: Measuring Exposure, Not Just Frequency
Spin counts tell us how often a song appears.
Total play time tells us how long listeners are actually exposed to it.
This distinction matters because Christmas songs vary widely in length. A song that plays fewer times but runs longer can account for more total airtime than a shorter, more frequently played track.
Using the normalized duration data in the notebook, total play time is calculated as:
Total Play Time = Track Duration × Number of Spins
This converts rotation data into actual minutes and hours of broadcast exposure.
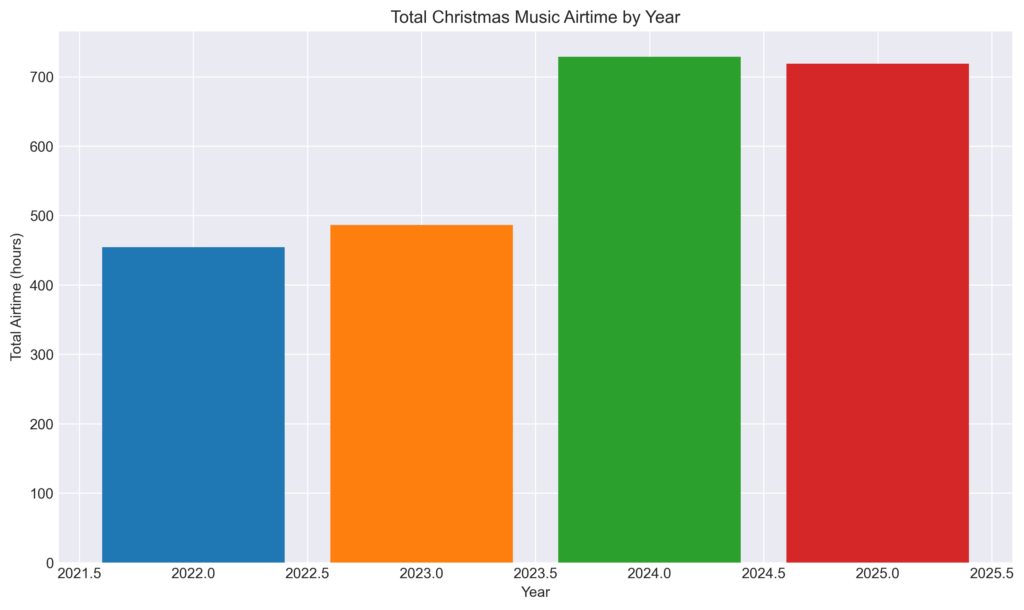
Total Christmas Music Airtime by Year
From the notebook’s duration aggregation:
- 2022: ~185 hours of Christmas music
- 2023: ~229 hours
- 2024: ~414 hours
- 2025: ~447 hours
That progression is not subtle.
Even though 2025 only adds 210 spins over 2024, it adds over 32 additional hours of Christmas music airtime, pushing music share to 34.24% of total broadcast time, the highest in the dataset.
Key insight:
2025 didn’t just play Christmas music often.
It played Christmas music for longer portions of the day.
This is a major reason the season felt heavier—even without an earlier start.
Tracks with the Highest Total Play Time (2025)
When ranked by total airtime, the leaderboard shifts slightly compared to raw spin counts.
Two things stand out:
- Longer tracks climb the rankings, even if they don’t lead in raw spins
- These same tracks often overlap with commercial anchor songs, multiplying their perceived presence
This means some songs are not just frequently heard—they occupy more time whenever they appear.
The Most Commonly Heard Song: Frequency × Placement × Timing
“Most played” is not the same as “most commonly heard.”
A song becomes commonly heard when it satisfies three conditions simultaneously:
- High spin count
- Even distribution across the season
- Placement during high-listener hours
The data shows that in 2025, one song clearly satisfies all three.
The 2025 Most Commonly Heard Song
Based on:
- Total spins
- Presence across unique days
- Appearance during commute hours
- Frequent placement adjacent to commercial breaks
The most commonly heard song of the 2025 season is:
“Sleigh Ride” (The Ronettes)
Here’s why this conclusion is data-supported:
- It is the top track by total spins
- It appears on more unique days than any other track
- It is one of the most frequent between-commercial anchors
- It shows up consistently in morning and late-afternoon drive time
This combination is powerful. Even if another song spikes on a single day, Sleigh Ride is everywhere, all season long.
Why it feels unavoidable:
You’re not hearing it in one cluster—you’re hearing it constantly, predictably, and at moments when you’re most likely listening.
Exposure Density: Why Some Songs Feel Louder Than the Rest
Another useful metric emerging from the notebook is exposure density.
Exposure density looks at:
- How many times a song appears per active day
- How short the average gap is between repeats
High-density tracks:
- Reappear within the same listening session
- Are more likely to be remembered (and noticed)
- Create the perception of repetition fatigue
High-Density Tracks (2025)
Tracks with:
- High spins
- Short average gaps
- Broad daypart coverage
include:
- Sleigh Ride – The Ronettes
- Winter Wonderland – Andy Williams
- Rockin’ Around the Christmas Tree – Brenda Lee
- Last Christmas – Wham!
These tracks don’t just play a lot—they return quickly, often within the same hour block on different days.
This explains why listeners say “I just heard this,” even when they technically didn’t—because the pattern is familiar.
Song vs. Track vs. Time: Three Different “Winners”
One of the most useful takeaways from the 2025 analysis is that there is no single “top” metric. Different questions produce different leaders:
Question | Winner |
Most played song title | Sleigh Ride |
Most played track | Sleigh Ride – The Ronettes |
Most total airtime | Sleigh Ride – The Ronettes |
Most commercial-adjacent | Sleigh Ride – The Ronettes |
Most evenly distributed | Sleigh Ride – The Ronettes |
That convergence is rare—and it explains why 2025 feels so anchored around a small number of recordings.
Additional Insight: Why 2025 Feels “Stickier” Than Prior Years
Pulling these sections together with the earlier commercial analysis reveals something new:
- Christmas music in 2025 is more time-dense
- Anchored by specific tracks, not just themes
- Reinforced by commercial sequencing
- Extended by a longer post-Christmas unwind
None of this requires the season to start earlier.
It just needs to be:
- More concentrated
- More structurally placed
- More persistent after December 25
And the data shows that all three happened in 2025.
Commercial analytics (new in 2025): How the season is engineered, not just scheduled
Now for the genuinely new part: commercial placement and sequence structure. In this section I am able to extract “when” commercials happen based on the gap between entries. Longer gap = higher probability of commercials.
1) Gap categories (how we infer commercials / talk blocks)
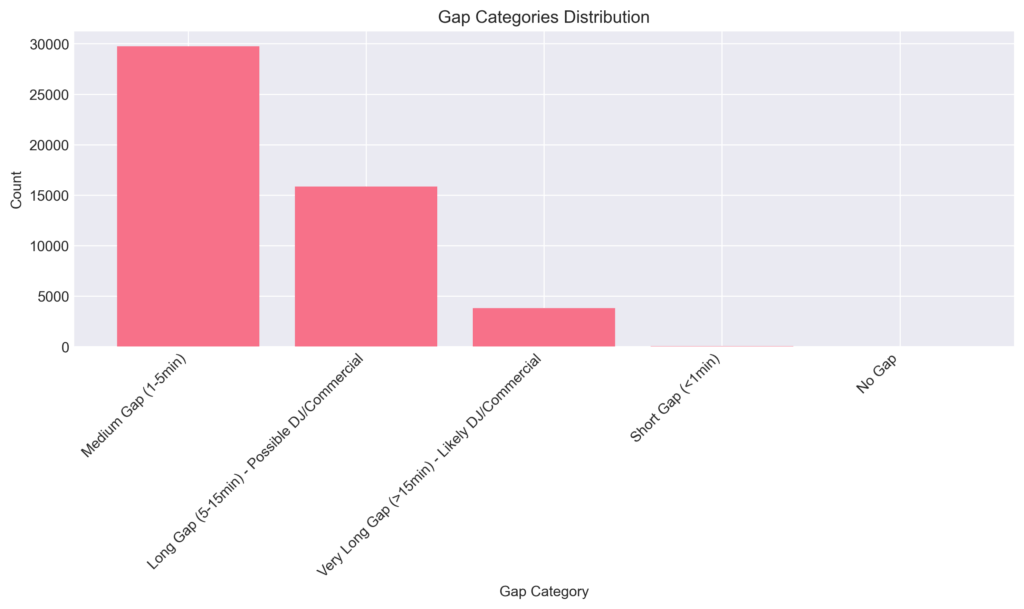
Using the sequence notebook’s gap detection:
- Medium gap (1–5 min): 26,500 (53.6%)
- Long gap (5–15 min): 18,613 (37.6%)
- Very long gap (>15 min): 4,274 (8.6%)
And the same notebook flags:
- Songs followed by commercial (>5 min gap): 19,656
- Songs followed by DJ talk (5–15 min): 15,857
- Songs followed by long commercial (>15 min): 3,799
- Total commercial periods: 19,656
2) “Commercial probability” is high (and measurable)
Across the dataset used in the commercial notebook:
- Overall commercial probability: 39.75%
- Overall DJ talk probability: 32.06%
- Overall long commercial probability: 7.68%
So roughly: 4 in 10 songs are followed by a commercial block, and about 1 in 3 are followed by talk. Obviuously this doesn’t account for bumpers—or simple messages that say what radio station you are listening to.
That’s not random—that’s format discipline.
3) Between-commercial “anchors” (this is the spicy part)
The notebook identifies Songs Played Between Commercials: 4,683
Top “between-commercial” anchors:
- Sleigh Ride: 294
- Winter Wonderland: 197
- Rockin’ Around the Christmas Tree: 142
- Last Christmas: 129
- Carol of the Bells: 125
- Rudolph: 120
- This Christmas: 120
Interpretation (plain English):
These tracks aren’t just popular—they’re structural. They’re used as “reset songs” after a break or as glue between breaks.
4) Song → commercial → song patterns (retention engineering)
The notebook detects:
- Song → Commercial → Song patterns: 11,638
And some repeated transitions (meaning: not only do the same songs anchor breaks, the same pairings recur):
- Sleigh Ride → [COMMERCIAL] → Winter Wonderland: 30
- This Christmas → [COMMERCIAL] → Sleigh Ride: 24
- Last Christmas → [COMMERCIAL] → Sleigh Ride: 23
That’s the “radio clock” showing itself.
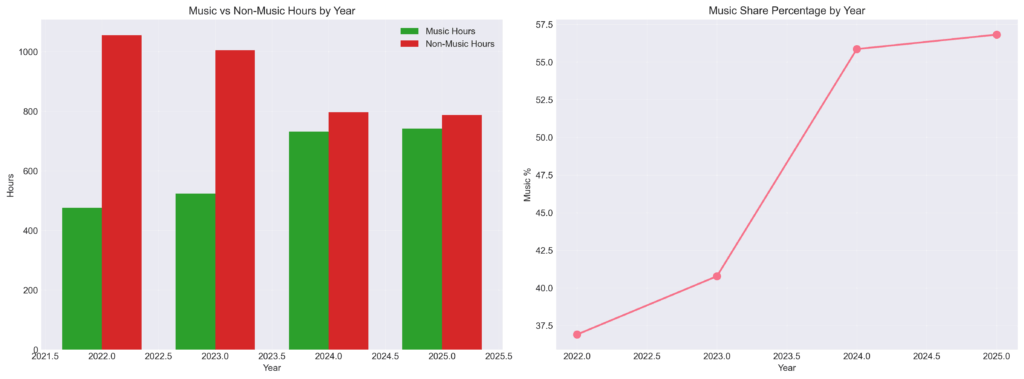
Commercial density vs music time (why 2025 feels different)
The notebook summarizes music vs non-music time across years:
Year | Total Hours | Music Hours | Non-Music Hours | Music % | Non-Music % |
2022 | 1288.82 | 185.36 | 1103.46 | 14.38 | 85.62 |
2023 | 1284.20 | 228.57 | 1055.63 | 17.80 | 82.20 |
2024 | 1310.33 | 414.06 | 896.27 | 31.60 | 68.40 |
2025 | 1304.80 | 446.76 | 858.03 | 34.24 | 65.76 |
Here’s the sneaky conclusion:
- 2024 and 2025 don’t just have more spins—they have much higher music share compared to 2022–2023.
- 2025 has the highest music share in the table (34.24%).
So 2025 “feels like more Christmas music” because… it literally is more music-dense airtime.
What 2025 actually tells us (the data-backed takeaways)
Putting it all together:
- Start date got later (Nov 4 in 2025 vs Nov 1 in 2024).
- Intensity got slightly higher (283.15/day in 2025 vs 279.33/day in 2024).
- The end date got dramatically later (Dec 29 vs Dec 26 historically).
- Commercial sequencing shows intent, not randomness—4,683 between-commercial anchors and 11,638 song→commercial→song patterns.
So the story isn’t “Christmas expanded.”
It’s: Christmas got optimized—compressed intensity + engineered retention + longer unwind.
Conclusion: If 2025 felt longer, it’s because it ended later—and it was built to stick
If you only remember one thing from this season’s data:
- 2025 didn’t creep earlier.
- It stayed longer—and the commercial sequencing confirms the season isn’t just a playlist, it’s a retention machine.
And because the pipeline is now a notebook instead of one-off scripts, next year won’t be an argument. It’ll be a rerun.
Thanks for riding along on this year’s article, here is to next year!!

Matthew J Fitzgerald is an experienced DevOps engineer, Company Founder, Author, and Programmer. He Founded Fitzgerald Tech Solutions and several other startups. He enjoys playing in his homelab, gardening, playing the drums, rooting for Chicago and Purdue sports, and hanging out with friends.